FINANCE
APRIL 30, 2021
what is forex chart and how to read it
Forex is short for ‘Foreign Exchange’, the act of buying and selling various currencies in the foreign exchange market. The forex players, determine the relative value for the conversion of one currency to another via the buying a selling of currency pairs.
They are retailers, investors, speculators and institutions in the global market. The daily turnover predicted to be in excess of 5.3 trillion dollars and it’s a very dynamic and liquid marketplace.
Basically, forex is the business of conversion. Forex is always quoted in pairs, since we are always comparing the value of one currency to another.
For example, the quote of USD/IDR shows how many Indonesian Rupiah you will get for one US Dollar.
USD / IDR
(base)/(quote)
The first currency is called the base while the second one is called the quote. When we buy a currency pair we buy the base currency and when we sell it we sell the quote currency. Just like that.
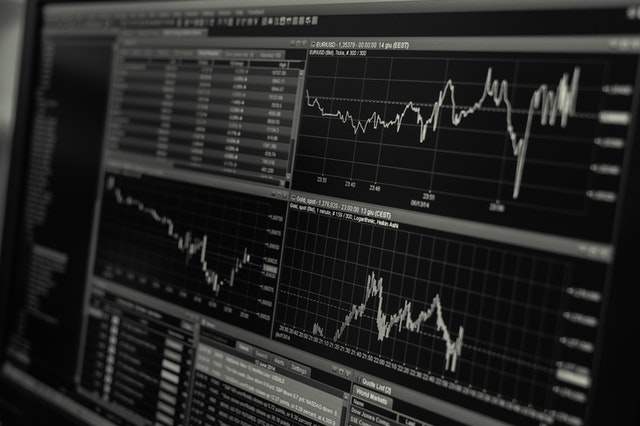
A forex chart is used to get a graphical representation of a currency pair’s exchange rate moves. The chart is representing exchange rate moves with just small differences. It is a simple way to analyse and compare past price movements and the current price-action.
Using technical chart analysis we can anticipate future movements of the rate. Forex charts can come in a variety of forms, such as line charts, bar charts and candlestick charts.
Forex charts can be set for variety of currency pairs, such as EUR/USD and GBP/USD (major pairs) or AUD/CAD and NZD/JPY (minor pairs).
A forex chart depicts the historical behavior of a currency across various time frames graphically. It is a price chart showing the price and volume data on one or more currency pairs along with technical patterns and indicators.
The Forex line chart is the same as the line chart we learned in science class in grade school. It consists of two axes perpendicular to one another. The horizontal or x-axis of a forex chart denotes the time while the vertical or y-axis denotes prices or the exchange rate. Prices from specific times are placed on the vertical axis at the same interval between any two prices and connected with a line.
Technical analysts and traders will look at such charts in order to identify trends and many patterns that can show reversals, continuations, entry points, and exits.
Many traders use forex charting software to determine the most possible direction on a given currency pair. They combine the software with other technologies such as predictive forecasting software to get the best results in forex markets. It is called forex chart analysis.
Forex chart analysis is the science of analyzing the forex market’s price charts to guess or forecast their next direction. Let’s say we want to know whether IDR’s value will go up against US dollar or not. We refer to the IDR/USD price chart that shows the fluctuations of IDR to USD rate.
By using some chart analysis techniques to analyze the price chart, we come to one of these conclusions:
- IDR’s value will go up against USD.
- IDR’s value will go down against USD.
- IDR’s value will go up and down against USD, within a certain range.
- We don’t know and we cannot make any forecast or conclusion.
All conclusions are good when they are correct. The first one tells you to buy and the second one tells you to sell IDR against USD. The third one tells you either to stay away from this market or buy and sell inside the range when there is a buy and sell signal inside the range. The last one shows you to wait for the market to form a clear buy or sell signal.
The last conclusion is the wisest and has no risks. When a forex trader comes to this conclusion that they must wait, it means they have also developed the discipline they need to trade. Remember, forex trading is not just the chart analysis techniques. It is more psychological than technical.
related post